
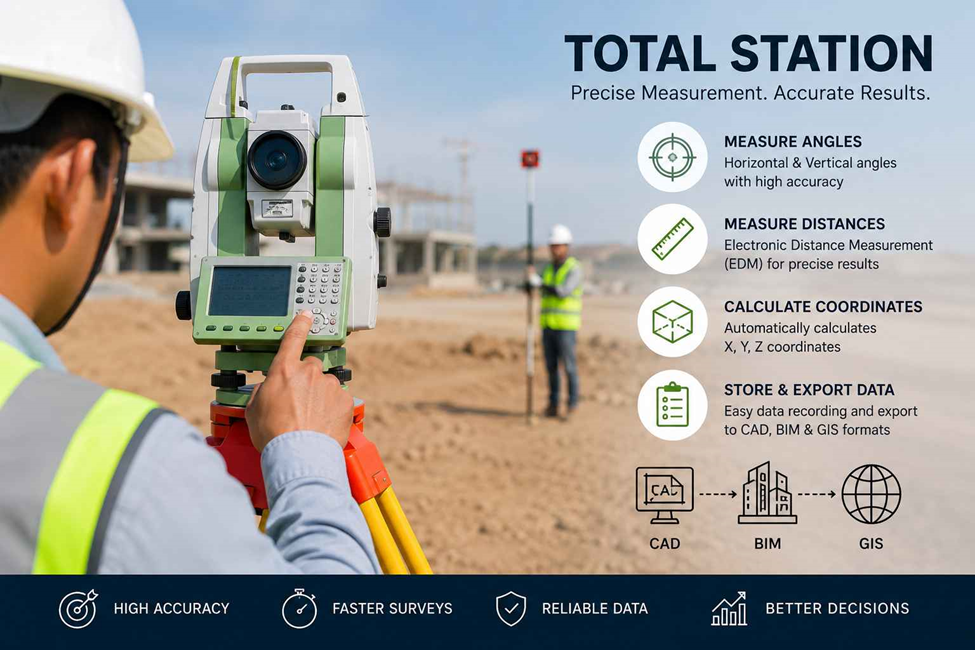
A total station sitting on a tripod at a job site looks like a fairly simple instrument, but the numbers it records end up driving decisions across an entire project lifecycle. Raw angle and distance readings taken in the field eventually turn into drawings that engineers stamp, models that contractors build from, and databases that utility companies rely on for decades. Understanding how that data moves from the instrument into CAD, BIM, and GIS platforms helps explain why field accuracy matters so much, and why the workflow connecting survey and design has become one of the more important pieces of modern engineering practice. This piece walks through what total station data actually contains, how it gets processed into drawings and models, and where it lands once it reaches downstream software.
What Is Total Station Data?
A total station combines an electronic theodolite with an electronic distance meter (EDM), letting a surveyor record a point’s position relative to the instrument in one reading. The raw output usually gets stored on the instrument or a data collector, then exported as a coordinate file. That file typically contains four categories of information.
Coordinates (X, Y, Z) Every shot the instrument takes gets reduced to a three-dimensional coordinate — easting, northing, and elevation — tied to either a local site grid or a national/state plane coordinate system. These coordinates are the backbone of everything that follows; if they’re off, every downstream drawing inherits the error.
Angles Horizontal and vertical angles are measured from the instrument’s known station to the target, usually a prism pole or reflectorless target. Angular precision on a modern total station is commonly in the 1–5 arc-second range, which is what allows the instrument to hold tight tolerances over long sightlines.
Distances Slope distance gets measured by the EDM and then corrected for atmospheric conditions, prism constant, and instrument height before being reduced to horizontal and vertical components.
Feature codes Most field crews attach a code to each shot — CL for centerline, EOP for edge of pavement, TREE, MH for manhole, and so on. These codes are what let CAD software automatically connect points into linework and symbols instead of leaving a surveyor to manually join hundreds of dots later. Feature coding is arguably the single biggest time-saver in the whole workflow, since a well-coded field file can auto-generate 70–80% of a topographic drawing.
How Total Station Data Is Processed in CAD
Once the coordinate file is downloaded, it gets imported into a CAD platform — Civil 3D, MicroStation, or similar — where the raw points turn into usable drawings.
Survey drawings The import process reads the point ID, coordinates, and feature code together, plotting each point and, where linework rules exist, connecting related points automatically. A surveyor then reviews the drawing against field notes to catch any misreads or coding errors before it’s signed off as a base survey.
Topographic plans Once points are plotted, software interpolates a triangulated irregular network (TIN) from the elevation data to generate contours. This is where total station density really shows — sparse or poorly distributed shots produce contours that look plausible but misrepresent actual ground shape, particularly in areas with grade breaks or drainage features.
As-built drawings For construction verification, total station shots of completed work — slab elevations, pipe inverts, structural steel positions — get compared directly against design coordinates. The deviation between design and as-built data becomes part of the permanent project record and is often required by the client or authority having jurisdiction before final handover.
Using Total Station Data in BIM
Building Information Modeling depends on accurate spatial input, and total station survey is usually the first real-world dataset that touches a BIM model.
Existing condition modelling Before any design work starts on a renovation or brownfield site, a total station survey of existing structures, grades, and utilities gets converted into a 3D model — sometimes supplemented by laser scanning for complex facades or interiors. This existing-conditions model becomes the geometric anchor that the rest of the BIM model is built against.
Construction coordination During construction, total stations get used for layout — pushing design coordinates from the model back into the field so crews can set out columns, walls, and MEP penetrations to the exact position shown in the BIM model. This bidirectional flow, model to field and field back to model, is what keeps construction tolerances tight.
Clash detection support Verified as-built coordinates feed back into the federated model so that clash detection reflects actual built conditions rather than design assumptions. Catching a misplaced duct or a slab poured a few centimeters out of tolerance before the next trade builds on top of it avoids costly rework later in the schedule.
GIS Integration with Total Station Data
Once a project reaches the asset or infrastructure stage, total station data typically gets absorbed into a Geographic Information System where it lives alongside broader spatial datasets.
Utility mapping Underground and above-ground utility positions surveyed with a total station — valves, hydrants, manholes, cable routes — get imported into GIS as point, line, or polygon features with attribute data attached. This is often the most accurate layer in a utility GIS, since it’s captured from direct measurement rather than digitized from as-built plans.
Asset management Municipalities and utility operators use surveyed coordinates to populate asset registers, linking each physical feature to inspection schedules, maintenance history, and lifecycle data. The positional accuracy from total station survey is what makes it possible to locate an asset in the field again years later without guesswork.
Spatial database creation Coordinate and attribute data get structured into geodatabases that support spatial queries — proximity analysis, network tracing, buffer zones around infrastructure — which planning and engineering teams rely on for everything from utility conflict checks to zoning review.
Benefits of Total Station Digital Workflows
High survey accuracy Modern total stations routinely achieve sub-centimeter accuracy under good conditions, which is what allows CAD and BIM models to be trusted for construction-grade decisions rather than treated as approximate references.
Faster data processing Digital coordinate files eliminate manual field-book transcription, cutting the gap between field collection and usable drawing from days down to hours in many cases.
Reduced field errors Feature coding and electronic data collection remove the transcription mistakes that came with manual booking — misread angles, transposed digits, and lost field notes are largely eliminated.
Better project coordination A shared coordinate system across survey, design, and construction teams means everyone is building against the same spatial reference, which cuts down on the coordination errors that used to surface only after concrete had already been poured.
Applications in Engineering and Construction
Topographic survey Total stations remain a primary tool for capturing ground shape, drainage patterns, and existing features on sites where GNSS accuracy is compromised by tree cover or urban canyon effects.
Setting out survey Design coordinates get pushed to the total station so crews can stake out building corners, road centerlines, and utility trenches with the precision needed to match approved drawings.
Boundary survey Legal boundary work depends on precise angle and distance measurement tied back to control monuments, making total stations the standard instrument for cadastral and property line surveys.
Road and infrastructure projects Linear infrastructure — roads, pipelines, rail corridors — relies on total station data for alignment verification, cross-section checks, and earthwork volume calculations throughout construction.
Conclusion
Total station data is the connective layer between what actually exists on the ground and what gets designed, built, and managed afterward. The same coordinate file can end up shaping a topographic plan in CAD, anchoring an existing-conditions model in BIM, and populating an asset register in GIS — which is exactly why field accuracy and consistent coordinate systems matter as much as they do. Projects that treat survey data as a formality rather than a foundation tend to pay for it later, usually at the point where design and as-built conditions stop matching.
For projects across the UAE, working with a survey provider that understands how field data needs to move cleanly into CAD, BIM, and GIS platforms makes a measurable difference in how smoothly design and construction phases connect. ASW Abu Dhabi provides land survey services built around that kind of downstream accuracy, from topographic and boundary survey through to construction setting-out.
Related reading: Importance of Soil Testing Laboratories for UAE Building Regulations and Pre-Construction Survey Checklist Before Starting Any Building Project
FAQs
What’s the difference between a total station and GNSS/RTK survey? A total station measures angles and distances from a fixed, known point and works independently of satellite signal, making it more reliable under tree cover, indoors, or in dense urban areas. GNSS/RTK depends on satellite visibility but covers large open areas faster.
Can total station data be imported directly into BIM software like Revit? Yes — coordinate files are typically brought in through Civil 3D or a point cloud/points workflow, then linked or imported into Revit for existing-conditions modelling, keeping the survey coordinate system intact.
How accurate is total station survey data? Under normal field conditions, most modern total stations achieve accuracy in the 2–5mm range plus a small distance-proportional error, which is well within tolerance for construction-grade CAD and BIM work.
Why do feature codes matter so much in the CAD workflow? Feature codes let software automatically distinguish a curb from a tree from a manhole and apply the correct linework or symbol, which cuts drafting time significantly compared to manually classifying every point after the fact.
Is total station data useful for GIS if it wasn’t originally collected for mapping purposes? Yes, as long as it’s tied to a known coordinate system. Survey-grade coordinates are frequently the most accurate layer available in a municipal or utility GIS, even when the original purpose was construction survey rather than mapping.